Sleep Review and Needham & Co’s first quarter survey reveals that HST and APAP use grows, while sleep center bed numbers decline.
By Mike Matson, CFA
Sleep Disorders Evaluated
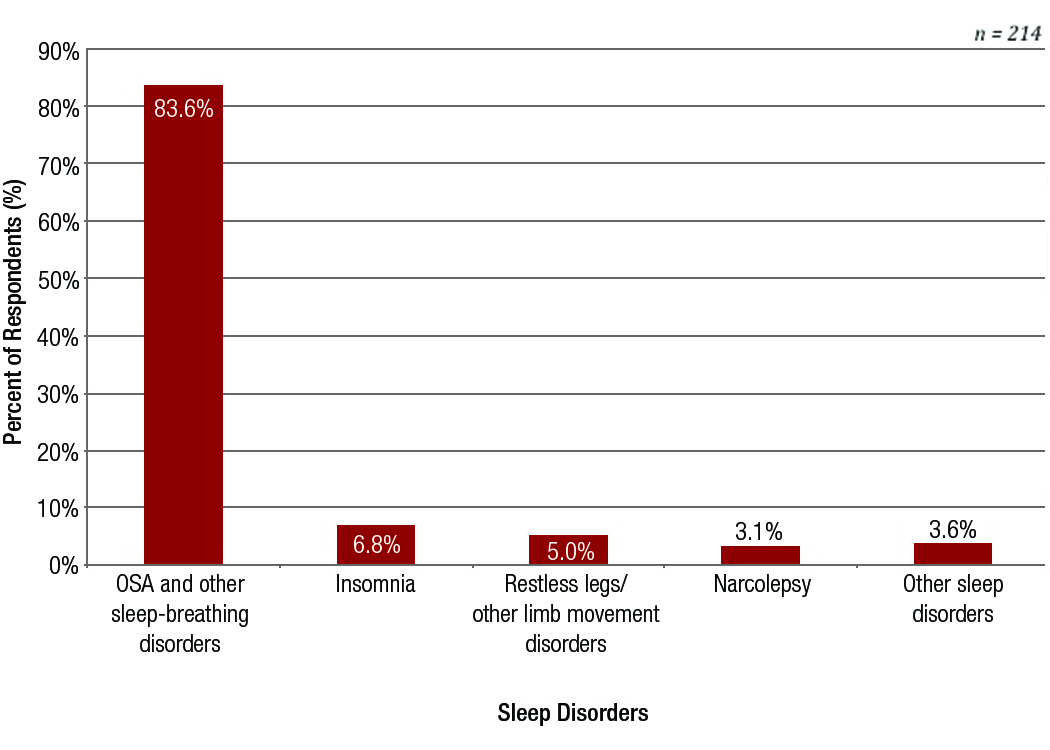
The vast majority of sleep center patients are being evaluated primarily for obstructive sleep apnea (OSA) and other sleep-breathing disorders (84%), while 7% were evaluated for insomnia, and 5% evaluated for restless leg syndrome and other limb movement disorders, according to the survey. Narcolepsy and other sleep disorders both accounted for less than 4% of the patients.
____________________________________________________________
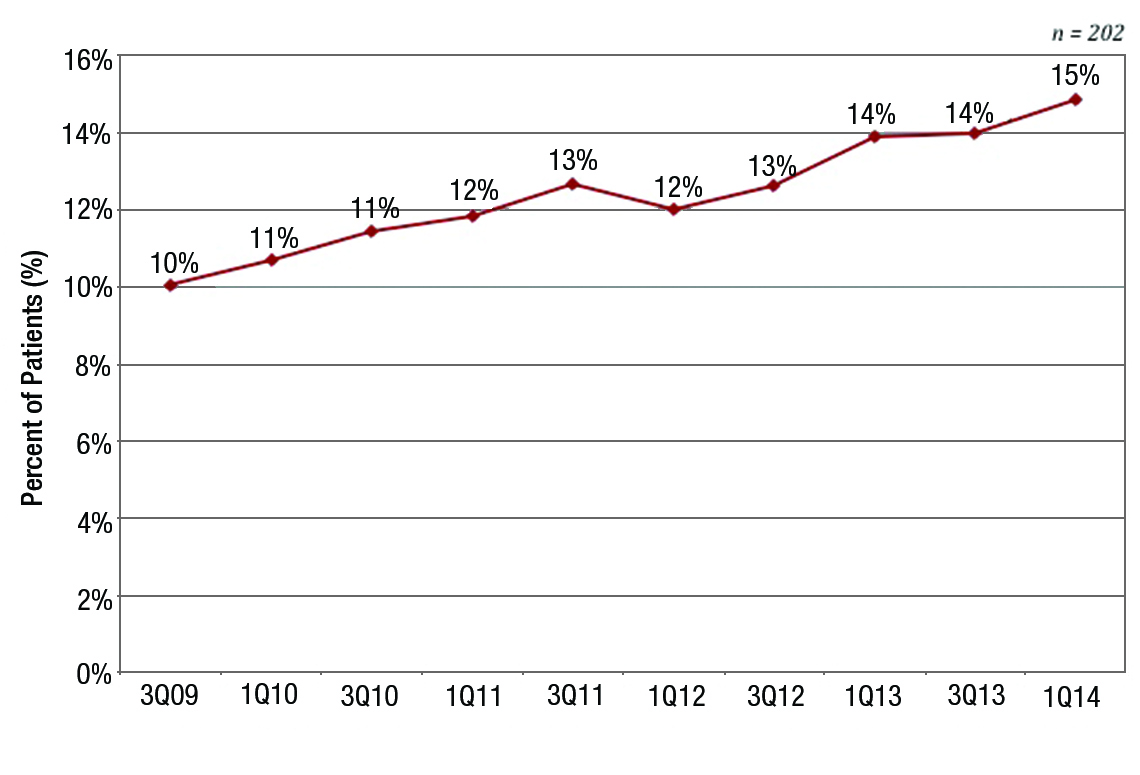
 Home Sleep Testing (HST)
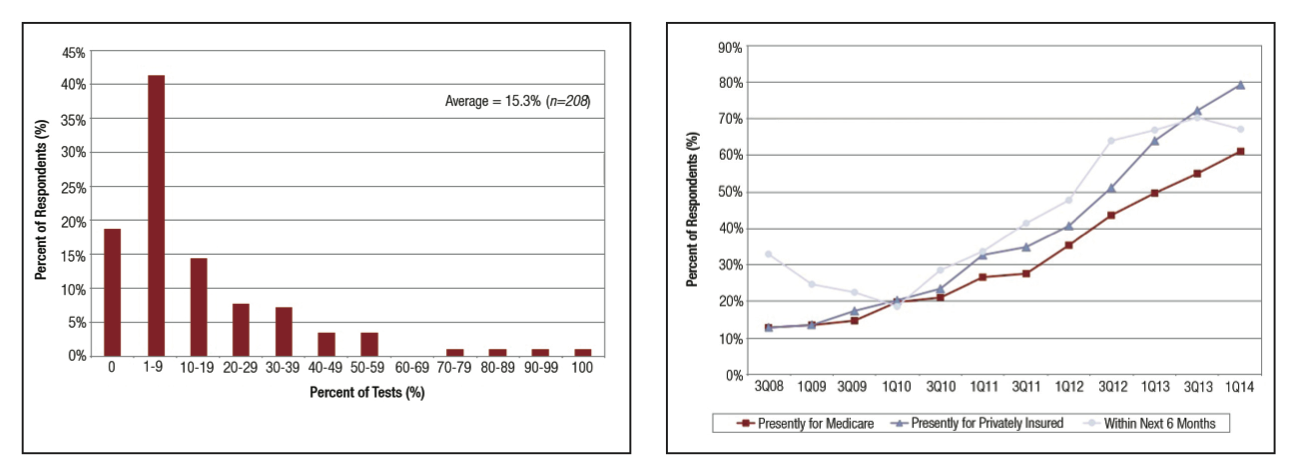
On average, 15% of OSA tests are done with HSTs rather than in-lab tests. Over time, we expect this to grow, although we did not ask respondents about their future expectations.
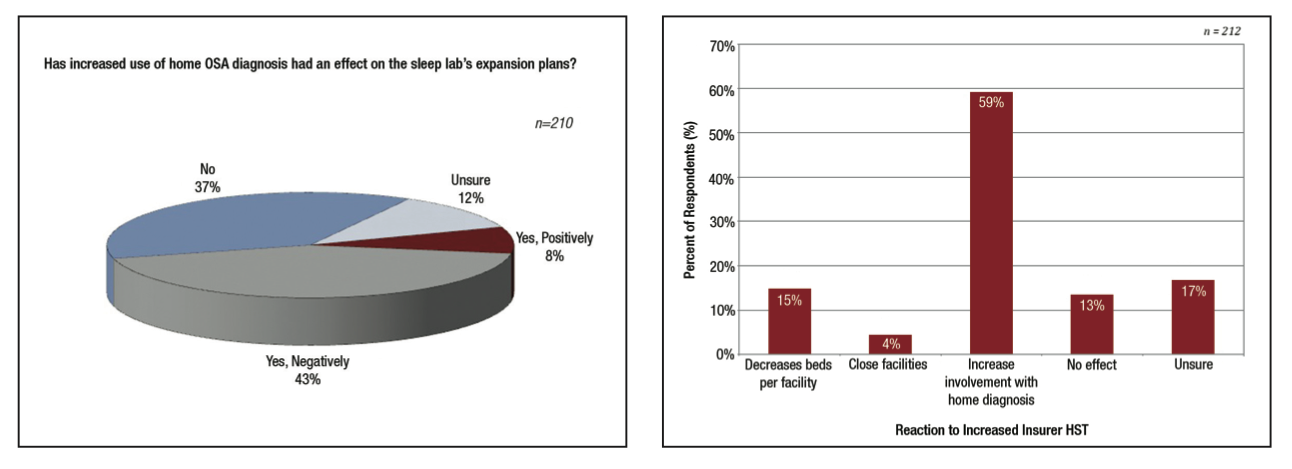
Currently, 79% of sleep centers offer HST for patients with commercial insurance compared to 61% that offer HST for patients with Medicare. In two other HST questions, 59% of respondents indicated that they expect to increase involvement in home testing, while 43% of respondents have reduced their expansion plans as a result of home testing. We think that increased use of HST is the primary factor behind the declining number of beds at sleep centers.
_____________________________________________________________
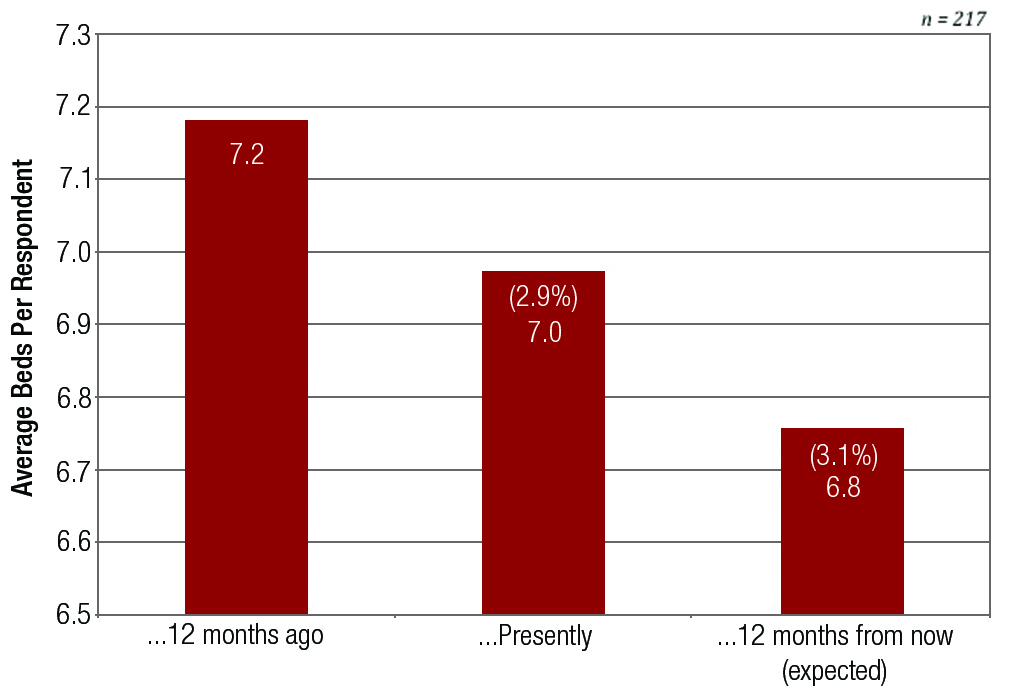
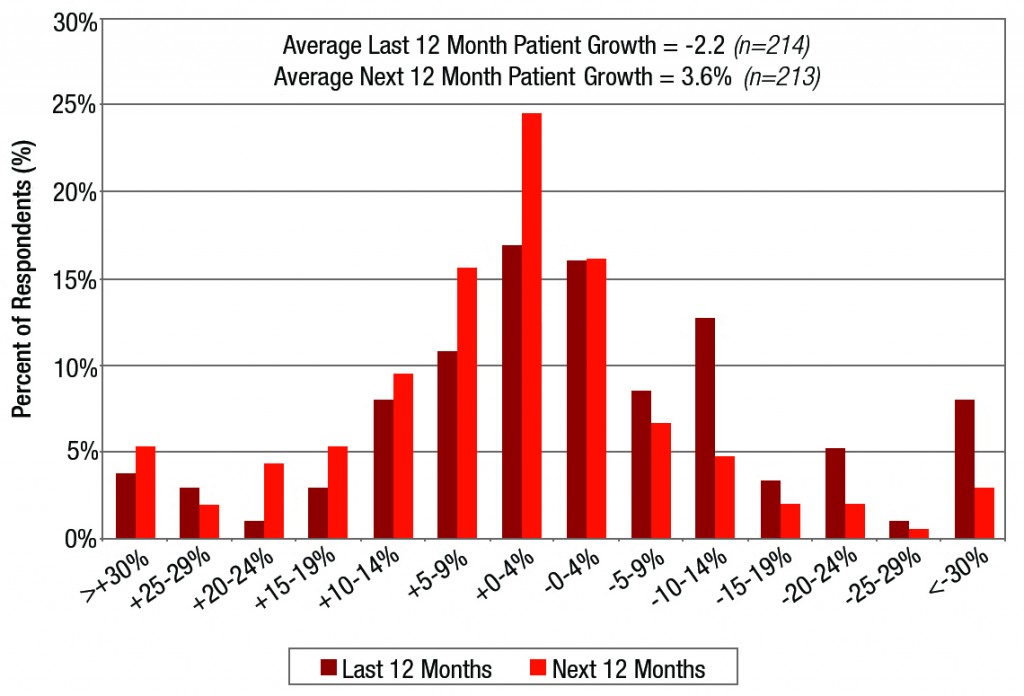 Beds and Patient Volume
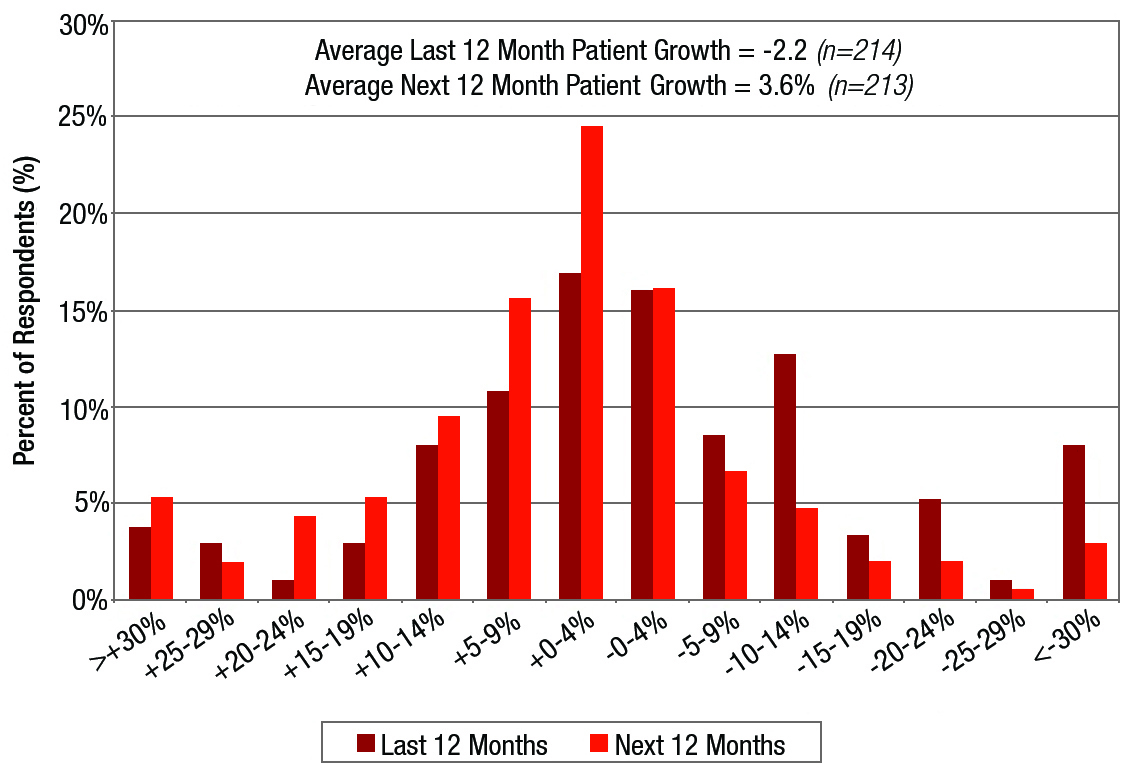
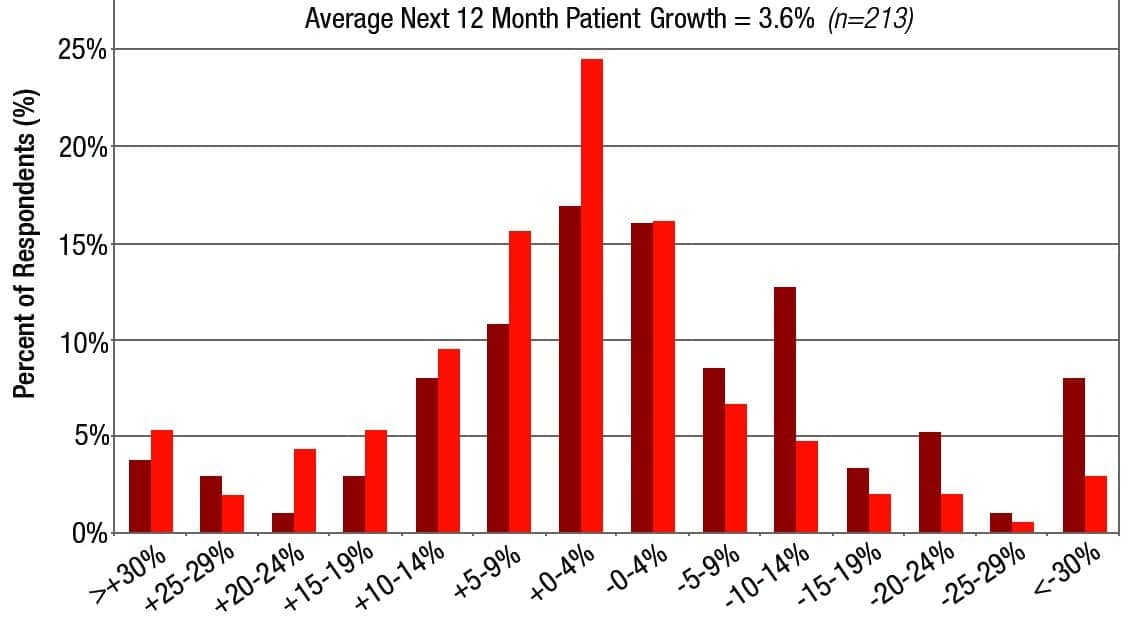
Sleep centers continued to contract as patient volume declined. Sleep centers reduced beds by 3% in the last 12 months, and expect to reduce beds by another 3% in the next 12 months. Patient volumes declined by 2% in the last 12 months, although the surveyed sleep centers expect volumes to increase by about 4% in the next 12 months. However, both of these measures may understate volume growth given the increased use of home sleep testing. We forecast 1%-4% growth for the US sleep market during 2014, consisting of 3%-4% volume growth, 4%-5% mix growth, and price declines of 5%-6%.
____________________________________________________________
Automatic Positive Airway Pressure (APAP) Devices
On average, respondents report that 14.8% of their patients use auto-setting flow generators, while only 13.0% of their patients use bilevel flow generators. Over the longer term, use of auto-setting flow generators has steadily climbed, while use of bilevel flow generators has been relatively stable. Increased use of auto-setting flow generators is probably the result of increased use of HST, since auto-setting flow generators do not require the patients to be titrated to determine the proper pressure setting.
______________________________________________________________

Oral Appliances
For the first time, we asked respondents about patients who start their OSA treatment with oral appliances (without first trying a PAP device); 49.5% indicated that between 1% and 9% of their patients took the oral appliance-first route, and 45.6% said 0% of their patients fall into this category. Only small percentages indicated that 10% or more of patients started with an oral appliance.
____________________________________________________________
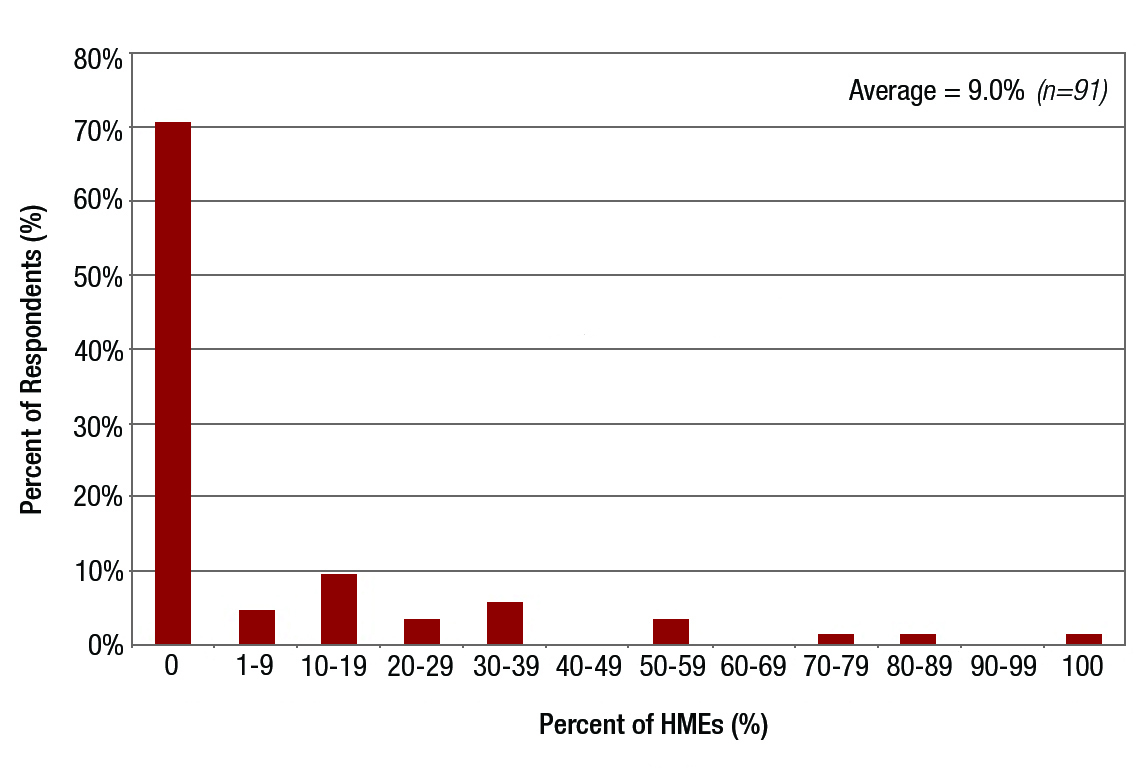
Branded Prescriptions
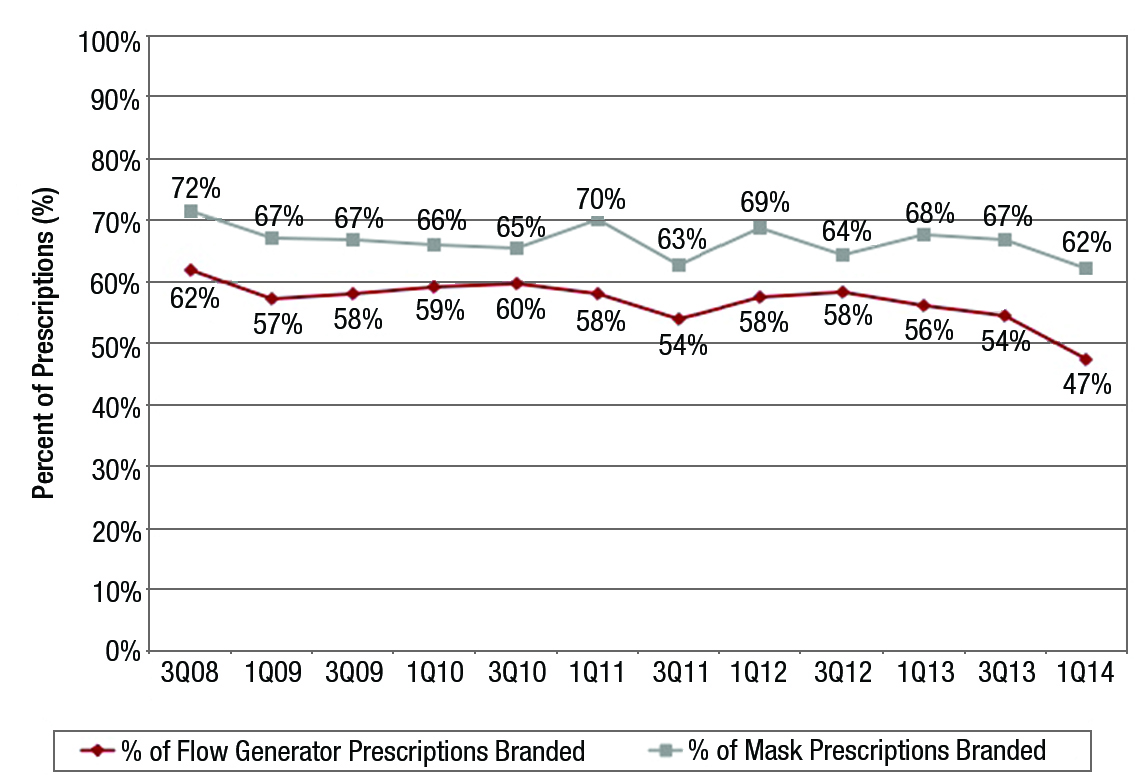
For the first time, we asked the respondents if home medical equipment companies (HMEs) were asking for changes to branded prescriptions as a result of competitive bidding. Only 13% of respondents said that they have been asked to switch to branded prescriptions, while 58% said they have not been asked. On average, respondents indicated that about 9% of the HMEs they are in contact with have asked for changes to branded prescriptions. On average, sleep centers reported writing brand-specific prescriptions for 62% of mask prescriptions and for 47% of flow generator prescriptions. While the rate of branded prescriptions has been relatively stable in recent years, this quarter’s decline may have been driven by push-back from HMEs, since 13% of respondents indicated that HMEs had asked them to change branded prescriptions.
______________________________________________________________
About the Survey
Needham & Company LLC and Sleep Review worked together to survey sleep centers around the United States about the current state of the domestic sleep market. The survey was emailed to around 12,000 sleep professionals, with 226 responses resulting in a response rate of about 2%. We note that response rates varied for each question since respondents were not required to answer every question. Of the respondents, 186 (82%) completed the entire survey. The responses were collected between January 17 and February 10, 2014. Sleep center directors/supervisors/managers (39% of respondents) and registered polysomnography technicians (29% of respondents) were the most common types of respondents. Every geographic region and 44 US states were represented, with the Midwest (28% of respondents) and Southeast (28% of respondents) most heavily represented. Click here to see how this year’s survey results compare to past years.
______________________________________________________________
Mike Matson, CFA, is a senior research analyst, medical technologies & diagnostics, at Needham & Company LLC. Questions about the survey may be sent to [email protected].


