
Bed and patient growth both increase, while home sleep testing appears to be peaking.
Bed Growth Increased
![Sleep Center Bed Growth, Time Series (click to enlarge)]](https://sleepreviewmag.com/wp-content/uploads/2016/10/Sleep-Center-Bed-Growth-Q3-2016.png)
Sleep Center Bed Growth, Time Series (click to enlarge)
Over the last 12 months (LTM), average beds per respondent increased slightly by 1% to 7.0 beds. But over the next 12 months (NTM), average beds per respondent are expected to increase by 9% from 7.0 beds to 7.6 beds. Bed growth increased from our prior survey (1Q16) in which LTM bed growth decreased by 1% and NTM bed growth was 5%.
Both LTM and NTM Patient Volume Growth Also Increased

Average Patient Volume Growth (click to enlarge)

Average Patient Volume Growth, Time Series (click to enlarge)
Over the LTM, respondents reported patient volume growth of 10%. And over the NTM, respondents expect patient volume growth of 11%. Both the LTM and NTM growth rates increased from 6% and 6%, respectively, in our 1Q16 survey. The historical and expected patient volume growth rates are different from the historical and expected bed growth rates (which were 1% and 9%, respectively). We continue to believe that the divergence is due to increased use of home sleep testing (HST) by the sleep centers.
We asked approximately how many patients have appointments at the respondent’s sleep center during a typical 7-day week. Respondents answered as follows:
- Less than 25 patients per week: 33.9%
- Between 25 and 50 patients per week: 31.2%
- Between 50 and 75 patients per week: 11.8%
- Between 75 and 100 patients per week: 7%
- Over 100 patients per week: 12.4%
- Unsure: 3.8%
Per patient revenue stayed the same as compared to a year ago report 41% of respondents. 38.2% report that per patient revenue has declined. 20.8% report that per patient revenue has increased.
For the first time, we asked, “In the past 12 months, has your sleep lab conducted the following in-lab studies?” Respondents answered as follows (we have ranked the tests those from conducted by the most labs to those conducted by the fewest labs):
- Diagnostic Overnight PSG Separate from Titration Study: Yes: 183; No: 4; Unsure: 0
- Split-Night PAP Titration Study: Yes: 179; No: 5; Unsure: 1
- PAP Titration Study Separate from Diagnostic HST or PSG: Yes: 176; No: 8; Unsure: 3
- Multiple Sleep Latency Test (MSLT): Yes: 174; No: 23; Unsure: 0
- Oral Appliance Device Titration Study: Yes: 82; No: 86; Unsure: 9
- In-Lab OSA Therapy Efficacy Study: Yes: 74; No: 73; Unsure: 28
- PAP NAP: Yes: 46; No: 113; Unsure: 15
Impact of HST Appears to be Leveling Off

Does Your Sleep Center Administer Home Tests? (click to enlarge)

Does Your Sleep Center Administer Home Tests? Time Series (click to enlarge)
The survey results show that on average 20% of obstructive sleep apnea (OSA) tests are done with in-home tests rather than in-lab tests. This is in line with 20% reported in our last two surveys, which could indicate that the impact of home sleep testing is waning.
Currently, 85% of sleep centers offer home sleep testing (HST) for patients with commercial insurance compared to 69% that offer home testing for patients with Medicare. This was in line with our prior survey as sleep centers adoption rates for HST remain stable.
In two other questions about HST, 23% of respondents indicated that home testing had negatively affected their expansion plans and 56% of respondents indicated that they expect to increase involvement in HST.
APAP Use Increased, Bilevel Use Stable

What Percentage of Your Sleep Patients Use an Auto-Setting Flow Generator? Time Series (click to enlarge)

What Percentage of Your Sleep Patients Use a Bilevel Flow Generator? Time Series (click to enlarge)
On average, respondents report that 21% of their patients use auto-setting flow generators (APAP) (slightly above the 19% in our prior survey), while 13% of their patients use bilevel flow generators (up from 12% in our prior survey).
Over the longer term, utilization of APAP has steadily increased while utilization of bilevel flow generators has been relatively stable. Increased use of APAP is probably the result of increased use of home sleep testing, since autosetting flow generators do not require the patients to be titrated to determine the proper pressure setting. Bilevel use stabilized after two consecutive quarterly declines that we suspect were driven by the results from ResMed’s SERVE-HF trial.
PAP Devices Dominate Sleep Apnea Therapy
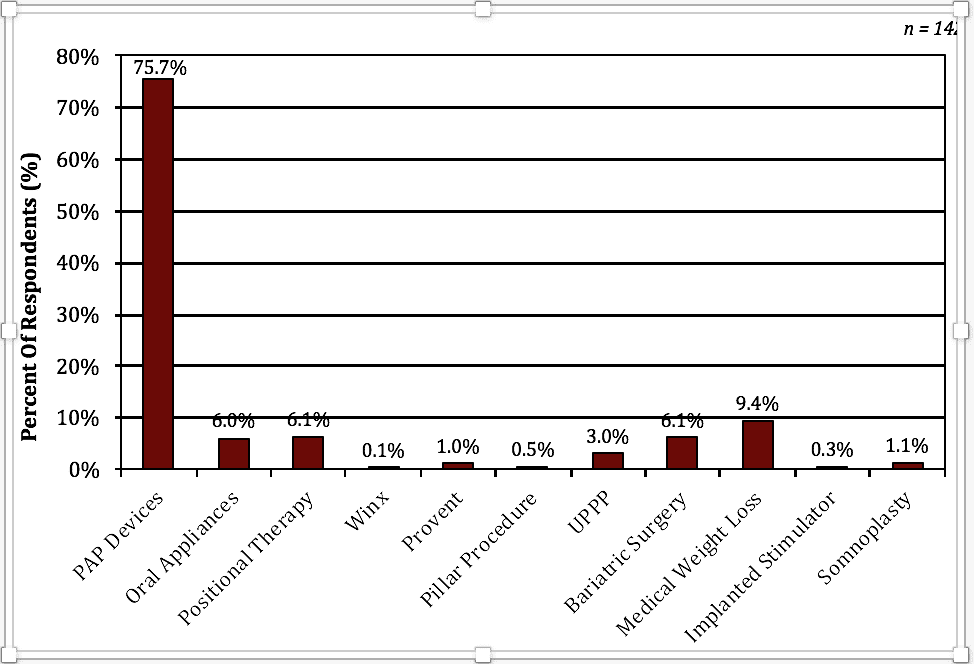
OSA Therapies Employed in Past 12 Months (click to enlarge)
The majority (76%) of sleep apnea patients have tried PAP devices. Use of PAP devices were followed by use of medical weight loss (non-surgical) by 9% of patients, use of positional therapy by 6% of patients, use of bariatric surgery by 6% of patients, and use of oral appliances by 6% of patients.
The complete results to this question in descending order are as follows:
- PAP Devices: 75.7%
- Medical Weight Loss: 9.4%
- Positional Therapy: 6.1% (tie)
- Bariatric Surgery: 6.1% (tie)
- Oral Appliances: 6.0%
- UPPP: 3.0%
- Somnoplasty: 1.1%
- Provent: 1.0%
- Pillar Procedure: 0.5%
- Implanted Stimulator: 0.3%
- Winx: 0.1%
The total surpasses 100%, as some patients may have tried (or currently use) more than one therapy.
In a separate question, we asked what percent of patients start their OSA therapy with an oral appliance.
On average, 4.6% of patients start their OSA treatment with an oral appliance. This compares to 4.4% in our 1Q16 survey. We specified that these are patients who have never tried a CPAP device.
ASV Use for Complex Sleep Apnea Is Stabilizing
Fifty-nine percent of respondents indicate that they treat patients with mixed or complex sleep apnea with ASV (either ResMed’s Adapt SV or Respironics Auto ASV), followed by bilevel CPAPs (17%), other treatments (12%), standard CPAPs (8%), and APAPs (4%).
Since ASV use peaked at 79% of complex sleep apnea patients in 1Q14, ASV use steadily declined to 57% of patients in 1Q16. However, ASV use appears to be stabilizing and increased slightly to 59% of patients in 3Q16. We suspect that the decline was mostly driven by the results from ResMed’s SERVE-HF trial that were disclosed in May of 2015 although the trial was focused on patients with heart failure and central sleep apnea rather than complex sleep apnea.
Number of HMEs Asking for Changes to Branded Prescriptions Decreased Slightly

Brand-Specific Flow Generator And Mask Prescriptions, Time Series (click to enlarge)
Around 20% of respondents indicated that they have been asked to make changes to branded prescriptions by HMEs due to competitive bidding. This represents a slight decrease from 21% in our prior survey. On average, respondents indicated that 19% of the HMEs to which they refer patients have asked for changes to branded prescriptions. This is in line with our prior survey.
On average, sleep centers reported writing brand-specific prescriptions for 65% of mask prescriptions and for 60% of flow generator prescriptions. The rate of branded prescriptions had been relatively stable in recent years.
Portion of Sleep Centers Selling CPAP Equipment Has Decreased
In this survey, 14% of sleep centers report selling CPAP equipment, down from 18% in our prior survey. Roughly 3% expect to start selling in the next 12 months. Over time, the portion of sleep centers selling CPAP equipment has varied but has generally declined over time.
About the Survey
Sleep Review and Needham & Company conducted a survey of US sleep centers. The survey received 189 responses between August 10, 2016, and September 1, 2016. Sleep center directors/supervisors/managers (44% of respondents) and registered polysomnographic technologists (33% of respondents) were the most common types of respondents. Every US geographic region and 45 different US states were represented, with the Midwest (34% of respondents) most heavily represented.
Mike Matson, CFA, is senior research analyst at Needham & Company LLC. He is an expert on the medical technologies and diagnostics sector. Sree Roy is editor of Sleep Review.


