
Read the 2014 salary survey results here.
Sleep Review’s 2013 Salary Survey shows minor decreases in most sleep professional salaries.
As can be expected, there were some ups and downs this year among salary numbers for those working in sleep-related professions. To provide insight on the wage fluctuations throughout the last 12 months, Sleep Review surveyed nearly 12,000 sleep professionals across the country.
Although the 2013 survey results paint an interesting picture of growth and decline among specific positions, it must be noted that the salary figures listed are the respondents’ base salaries; they do not include the value of additional bonuses, stock options, or other incentives.
Sleep Review’s annual Salary Survey always yields interesting measurements of compensation among peers. Yet, this year points to some interesting finds, including registered polysomnographic technologists, which reported a decline in median salary of 1.75%, while respiratory therapists and sleep physicians (MD) experienced similarly minor reductions (5.8% and 5.2%, respectively).
Other sleep professional job categories reported more significant drops. Sleep center director/supervisor/managers indicated a 17.6% decline in salary from a median of $85,000 in 2012 to $70,000 in 2013. Sleep center CEO/owner/vice president salaries plummeted 17.5% from a median of $100,000 in 2012 to $82,500 in 2013. Sleep technologists were the only profession to report an increase in median salary; however, data on the job category were limited.

SLEEP TECHNICIAN
Sleep technician salaries have yo-yoed over the past few years. The 2011 median salary for a sleep technician was $44,000, which went down to $39,695 in 2012. Now the reported median is $50,000, a 26% jump, which in part came from an unusually high reported median salary of $92,000 for the Mountain region. With that figure excluded, the jump was still high—19.6%. Limited data on sleep techs, a total of only eight responses, were received so the results should be interpreted with this in mind. Also, no data were reported for several regions. Median salaries varied with the East North Central region reporting a low of $43,500 and the Mountain region reporting a median of $92,000. The second-highest median came from the Middle Atlantic region, $57,000.

REGISTERED POLYSOMNOGRAPHIC TECHNOLOGIST (RPSGT)
Approximately 111 RPSGTs participated in the survey this year. RPSGT salaries remained relatively flat with a reported median salary decrease of 1.75% from $50,893 to $50,000. While most regions experienced minor declines in median salary, two regions saw significant increases. The East North Central region climbed from a median of $50,000 to $60,000 while New England rose from $47,000 to $56,500. The lowest reported median came from the Mountain region at $48,000 while the biggest drop came from the Pacific, declining from $61,000 to $52,500.
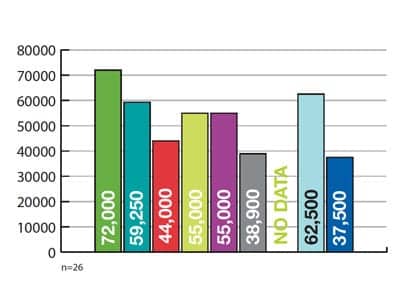
RESPIRATORY THERAPIST (RRT/CRT)
After experiencing a modest median salary increase of 2% from 2011 to 2012, respiratory therapists this year reported a 5.8% dip in median salary from $56,250 to $53,000. The highest reported median salary this year came from the Pacific region at $72,000, taking the reins from the West North Central region. Interestingly, the high mark this year was less than last year’s reported $80,000, a percentage change of 10%. The lowest reported salary went to the South Atlantic region, which came in at $37,500. This compares to last year’s low of $44,500 from the same region. Approximately 26 therapists participated in this year’s survey.
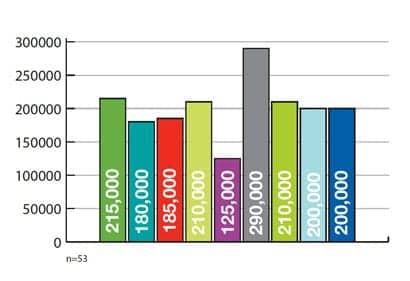
SLEEP PHYSICIAN (MD)
Sleep physicians saw a decline in median salary of 5.2%, coming in at $200,000 compared to 2012’s $211,000. This puts sleep physicians at the same spot they were in for 2011’s salary survey. East South Central region again reported the highest median salary at $290,000; however, this was less than last year’s reported $308,332. The lowest reported median salary was in the East North Central region, posting a median of $125,000. Approximately 53 sleep physicians participated in this year’s survey.
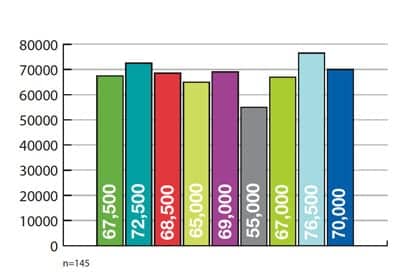
SLEEP CENTER DIRECTOR/SUPERVISOR/MANAGER
This year, 145 responses were tallied for the sleep center director/supervisor/manager category. Median salary was $70,000, down from $85,000 in 2012. Median salaries for all regions were relatively close in range; however, the Middle Atlantic region reported the highest salary at $76,500. This was a decline from last year’s highest reported region, the Pacific, which came in at $145,000.

SLEEP CENTER CEO/OWNER/VICE PRESIDENT
Overall, sleep center CEO/owner/vice presidents reported a decline in median salary from $100,000 in 2012 to $82,500 in 2013. East South Central region had the highest median salary at $123,000. The lowest median salary was in the South Atlantic region—$73,500. A total of 26 respondents registered responses for the category.
Other Titles
Sleep Review also requested responses from sleep-related job categories, such as nurse practitioner/physician assistants, dental sleep doctors (DDS, DMD), and other credentialed technologists (R.EEGT/R.EPT/R.EDT, CNIM, CPT). Responses were too low to break down into regions; however, median salaries were as follows:
• Nurse practitioner/physician assistant: $70,000 (n=3)
• Dental sleep doctor (DDS, DMD): $250,000 (n=6)
• Other credentialed technologist (R.EEGT/R.EPT/R.EDT, CNIM, CPT): $70,000 (n=6).
About the Survey
The survey was e-mailed to nearly 12,000 sleep professionals. Of these, 501 responded to the survey, resulting in a response rate of about 4%. The responses were collected between June 17 and June 27, 2013. Sleep center directors/supervisors/managers (36% of respondents) and registered polysomnographic technicians (26% of respondents) were the most common types of respondents. Every geographic region and 48 US states were represented, with the Midwest (31% of respondents) and Southeast (29% of respondents) most heavily represented.
It should be noted that our sample sizes were small with regard to particular regions and particular positions in both survey years. In addition, it is unlikely that we had the same responders as last year, so an apples to apples comparison between years cannot be assumed. For these reasons, we recommend that readers interpret the data with the above caveats in mind.


